Al's Website Al's Vita

Home
Summary Information Research Centers Scientists Blogs Science Websites Other Websites Charts Peer Reviewed Journals

Climate Related Charts and Graphs

In many cases click on the chart to obtain an enlarged view.

Global anthropogenic GHG emissions

From the IPCC Climate Change 2007 Synthesis Report, Summary for Policymakers, page 5.

Global anthropogenic GHG emissions
a) Global annual emissions of anthropogenic GHGs from 1970 to 2004 (b) Share of different anthropogenic GHGs in total emissions in 2004 in terms of carbon dioxide equivalents (CO2-eq). (c) Share of different sectors in total anthropogenic GHG emissions in 2004 in terms of CO2-eq. (Forestry includes deforestation.)

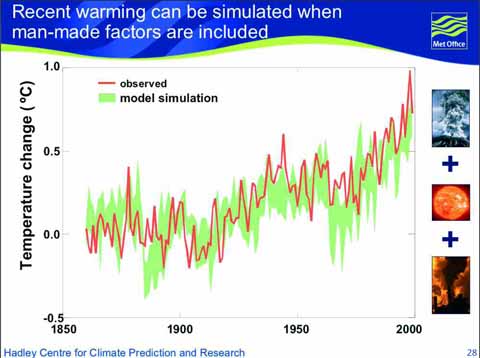
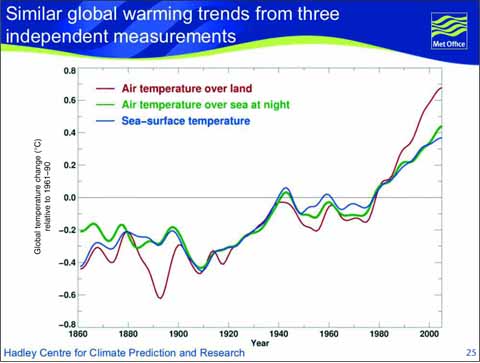
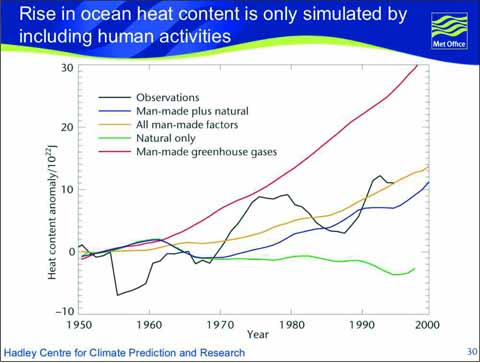
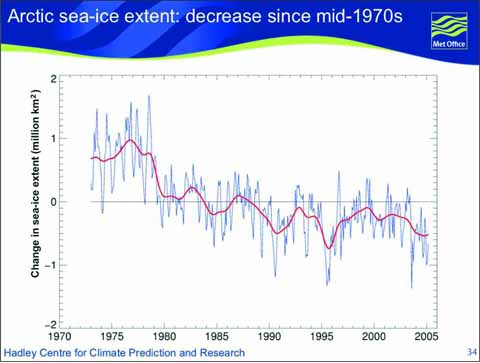
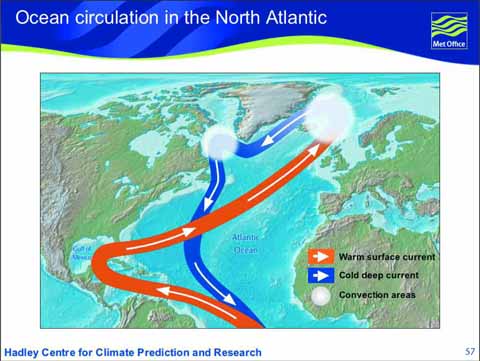
Climate Change and the Greenhouse Effect.

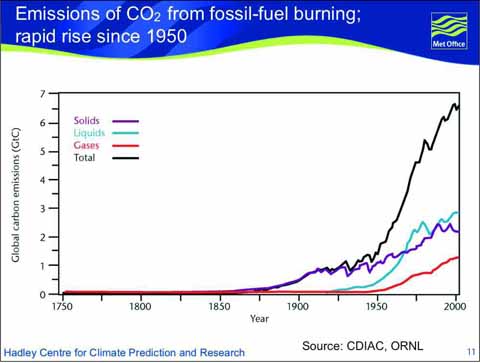
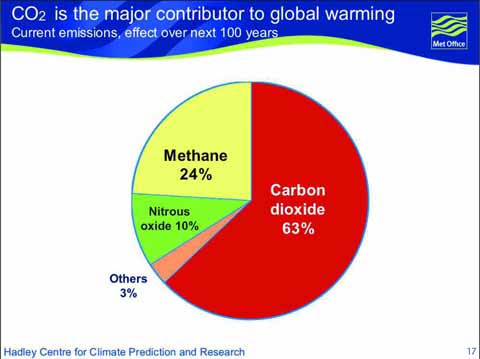
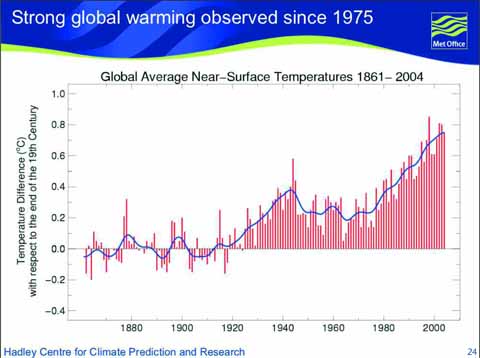
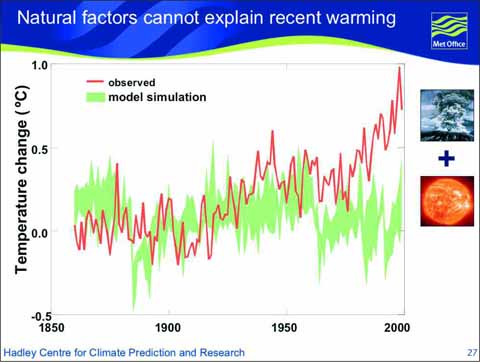
The following charts are selected from Climate Change and the Greenhouse Effect,  briefing from the Hadley Centre, December 2005.


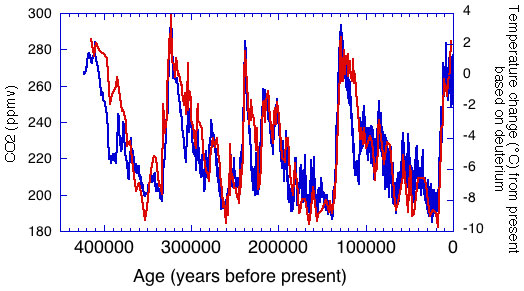
From "Temperature change and carbon dioxide change."


Temperature change (blue) and carbon dioxide change (red) observed in ice core records Many other records are available.


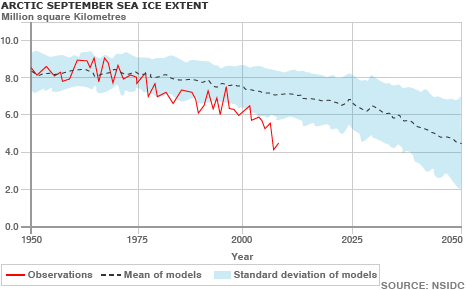
Arctic sea ice is currently being lost even faster than the models predict


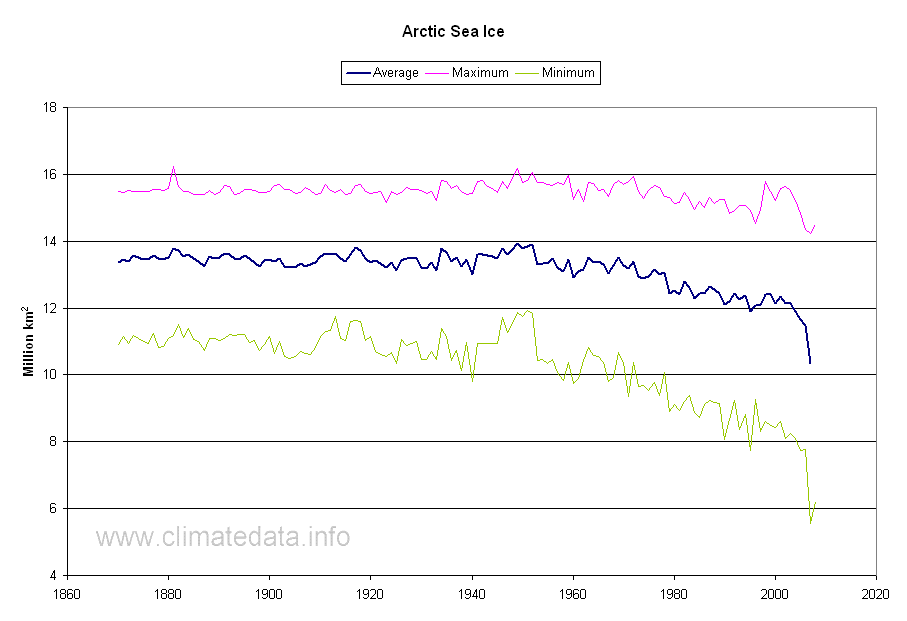
A chart of arctic sea ice extent from 1870 to 2008.  The raw data comes from the University of Illinois archives of arctic data here.  The specific table is found here.  An explanation as to where the data came from can be found here.