Al's Website Al's Vita

Home
Summary Information Research Centers Scientists Blogs Science Websites Other Websites Charts Peer Reviewed Journals

This Climate Science review is under development.  When I start work on a section I will provide a link to that section below.  Following the links below you will be able to access a great deal of information from other sources on Climate Change.  Much of that information will find it into the summary.  The purpose for me in developing this summary is make clear in my own mind what I know (and don't know) about Climate Science and to learn more in the process.


The earth's climate is an extremely complex system.  Science is learning more and more about that system each day and tools are constantly being developed to aid in the increasing body of knowledge of the climate system.  As science changes so will these pages change.

Favorite Sites

  1. Real Climate -- A blog by Schmidt, Mann, Rahmstort, Archer, etc.
  2. Climate Change -- A collection of current climate articles assembled  by Tenny Naumer
  3. Climate Progress -- A blog by Joe Romm
  4. Skeptical Science -- a blog by John Cook plus a number of contributors
  5. Climate Central -- An independent organization of leading scientists and journalists
  6. SourceWatch
  7. CO2.earth   Keeling Curve
  8. Capital Climate
  9. EPA Climate Change
  10. Arctic Sea Ice Graphs -- daily, regional, long-term graphs
  11. Water-data.com -- Water Databases & Colorado River
  1. Science Daily -- A science website posting current science articles
  2. Live Science -- A science website  posting current science articles
  3. Arctic Sea Ice News & Analysis -- from the National Snow and Ice Data Center
  4. Arctic Report Card
  5. Greenland Ice-Sheet Today -- from the National Snow and Ice Data Center
  6. Arctic Sea Ice Blog  -- A blog written by Neven
  7. Polar Science Center -- University of Washington
  8. CEJournal -- Center for Environmental Journalism
  9. Reuters Environment Forum -- Global environmental challenges
  10. Deep Climate -- Exploring climate science disinformation in Canada and beyond
  1. Climate Denier Crock of the Week
  2. Guardian Environment Network --
  3. Bulletin of the Atomic Scientists
  4. "Global Warming" at a Glance
  5. iCue -- From NBC News
  6. 1970's Climate Scientists
  7. AGW Observer
  8. Climate Physics

Al Crawford's Climate Science Review

 Atmospheric CO2


  • Arctic Sea Ice Volume:  
    The chart on the left gives the current anomaly in Arctic sea ice volume from the long term trend line.  The chart on the right charts the current sea ice volume.
  •    
  • Daily Averaged Arctic Sea Ice Volume over 1979-2009 Period

    The following Web sites have more information on the science of climate change:


    Below left is the University of Illinois Cryosphere Today's website graphic of the current sea ice coverage of the Arctic Ocean.  This graphic gives a view of the current ice conditions of the Arctic including the percentage of coverage of each area of the Arctic.  The one on the right is from the Daily Sea Ice Images from the National Snow and Ice Data Center  For a larger view click on the image.

             
    Comparison with historic average melt.


    GW Distribution
    The NOAA State of the Climate 2009 report is an excellent summary of the many lines of evidence that global warming is happening. Acknowledging the fact that the planet is warming leads to the all important question - what's causing global warming? To answer this, here is a summary of the empirical evidence that answer this question. Many different observations find a distinct human fingerprint on climate change:  See Here

    * CO2 emissions grew 5.9% in 2010 to reach 9.1 GtC (33.5Gt CO2), overcoming a 1.4% decrease in CO2 emissions in 2009 
    * Including land-use change and deforestation, in 2010 emissions reached 10.0 GtC (36.8 Gt CO2)
    * As of 2009 developing countries now emit more than developed countries in terms of consumption, and China now emits more than the US in terms of consumption  See Here

    A visual depiction of how much global warming heat is going into the various components of the climate system for the period 1993 to 2003, calculated from IPCC AR4 5.2.2.3.

     
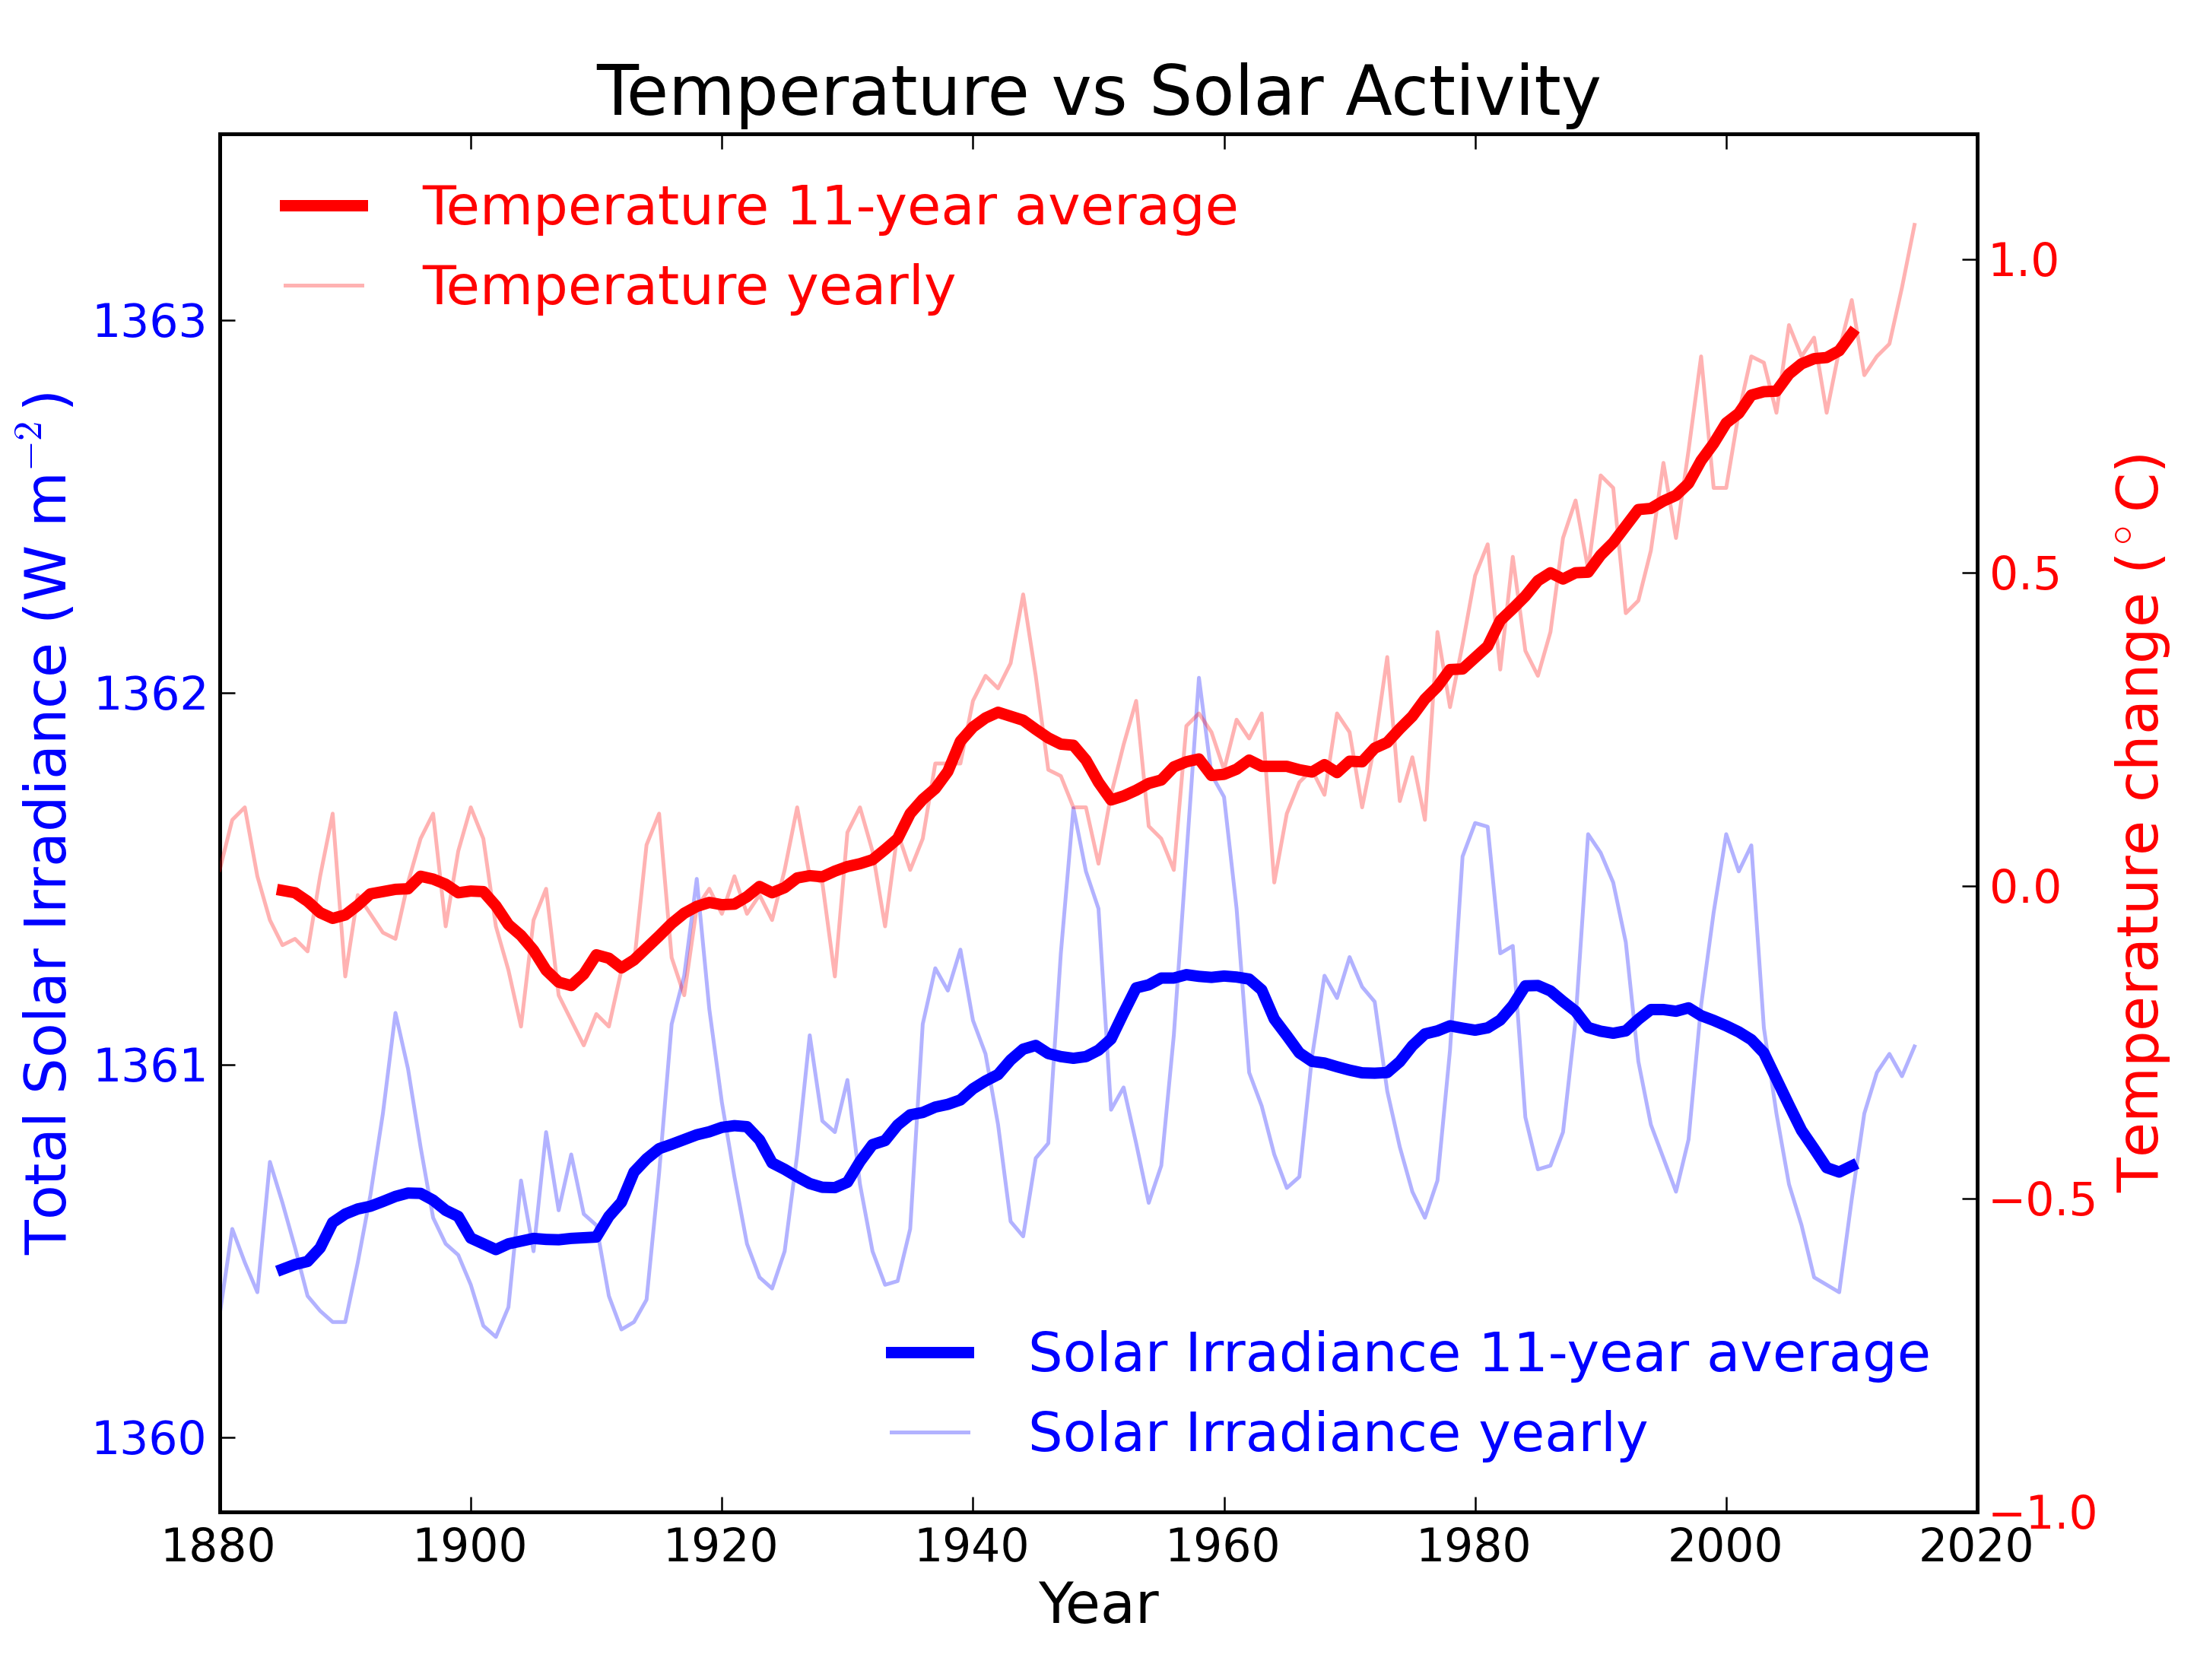
    Global temperature (red, NASA GISS) and Total solar irradiance (blue, 1880 to 1978 from Solanki, 1979 to 2009 from PMOD).  This graph is from Skeptical Science here.

    From National Climatic Data Center


    Made with Nvu